In February 2019, I spent almost a month at the Norwegian Geotechnical Institute (NGI) in Oslo. Firstly, to attend the ‘DENSER’ workshop and then staying for a few weeks to work on a few collaborative projects.
The ‘DENSER’ workshop was a two-day event, held at NGI’s offices, which focussed on cyclic behaviour of dense sands and complementary constitutive models. Invited speakers (and a few PhD students) attended from institutions worldwide. I was struck by the contrast of models presented; these ranged from explicit relationships, empirically estimating development of properties with cycles, to Discrete Element Method (DEM) models capturing behaviour at individual grain scale and many in between. There was much interesting discussion, particularly regarding possible benchmark tests for a more focused approach to modelling dense sands.
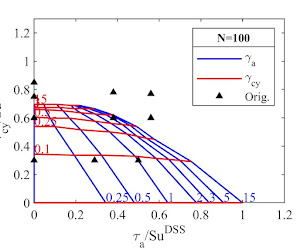
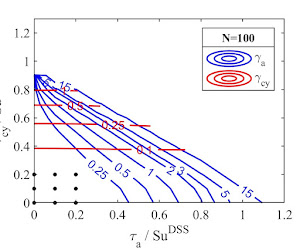
The following few weeks were spent in the office with the ‘Numerical Geotechnics’ group. The principal purpose of the visit was to use Hyperplasticity models developed at Oxford to back calculate cyclic element test data on clays acquired by NGI (in the form of contour diagrams). Contour diagrams are well used in industry and provide an inter/extrapolated picture of development of strain with cycles across the full stress space, based upon experience of numerous tests. Calculating these using a mechanistic model could perhaps shed light on the physical processes at play and form a useful test of the formulation of the model.

Figure 1 – The soil testing laboratory at NGI Oslo.
In the final week, we began work on a further collaboration, which aims to take advantage of Hyperplasticity models ability to predict response continuously and quickly for any load input. This aims to complement work undertaken at NGI as part of the WAS-XL (Wave loads and soil support for extra-large monopiles) project. Load histories (based upon time domain integrated analyses of a 10 MW wind turbine) were applied to a sample of over-consolidated North Sea clay in CSS conditions as irregular loading and as idealised packets of increasing magnitude. Predictions of the tests will be made using a model calibrated to constant-amplitude tests and the aim is to publish the work at the ISFOG conference in 2020.


Figure 2 – NGI contour plots in Drammen Clay at N=100. Left – original plot direct from CSS data. Right – back-calculated using Hyperplasticity models.
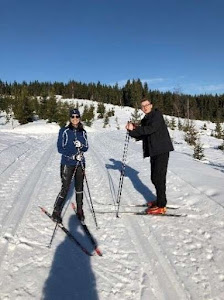
Oslo was an excellent place to spend a month, particularly in the winter. There is amazing nature at the end of each metro line and cross-country skiing routes outnumber roads! Highlights in Oslo include the Viking ship museum, the old winter Olympic tobogganing run (which can be accessed by metro), and the hike to Kolsåstoppen overlooking the city. Thanks to everyone at NGI for making me feel so welcome and for the many fruitful discussions. Particularly to Ana Page, who went out of her way to help shape the project and make sure I experienced the best parts of the city and surrounding areas.


Figure 3 – Cross country skiing with Ana. Hiking to Kolsåstoppen on the outskirts of Oslo.
Toby Balaam

